Spacenus GmbH
ANA
Economic zone evaluation
Mail support
Application maps for fungicides
Fertilizer cards - basic fertilization
Recommendation fertilizer quantities
Browser application

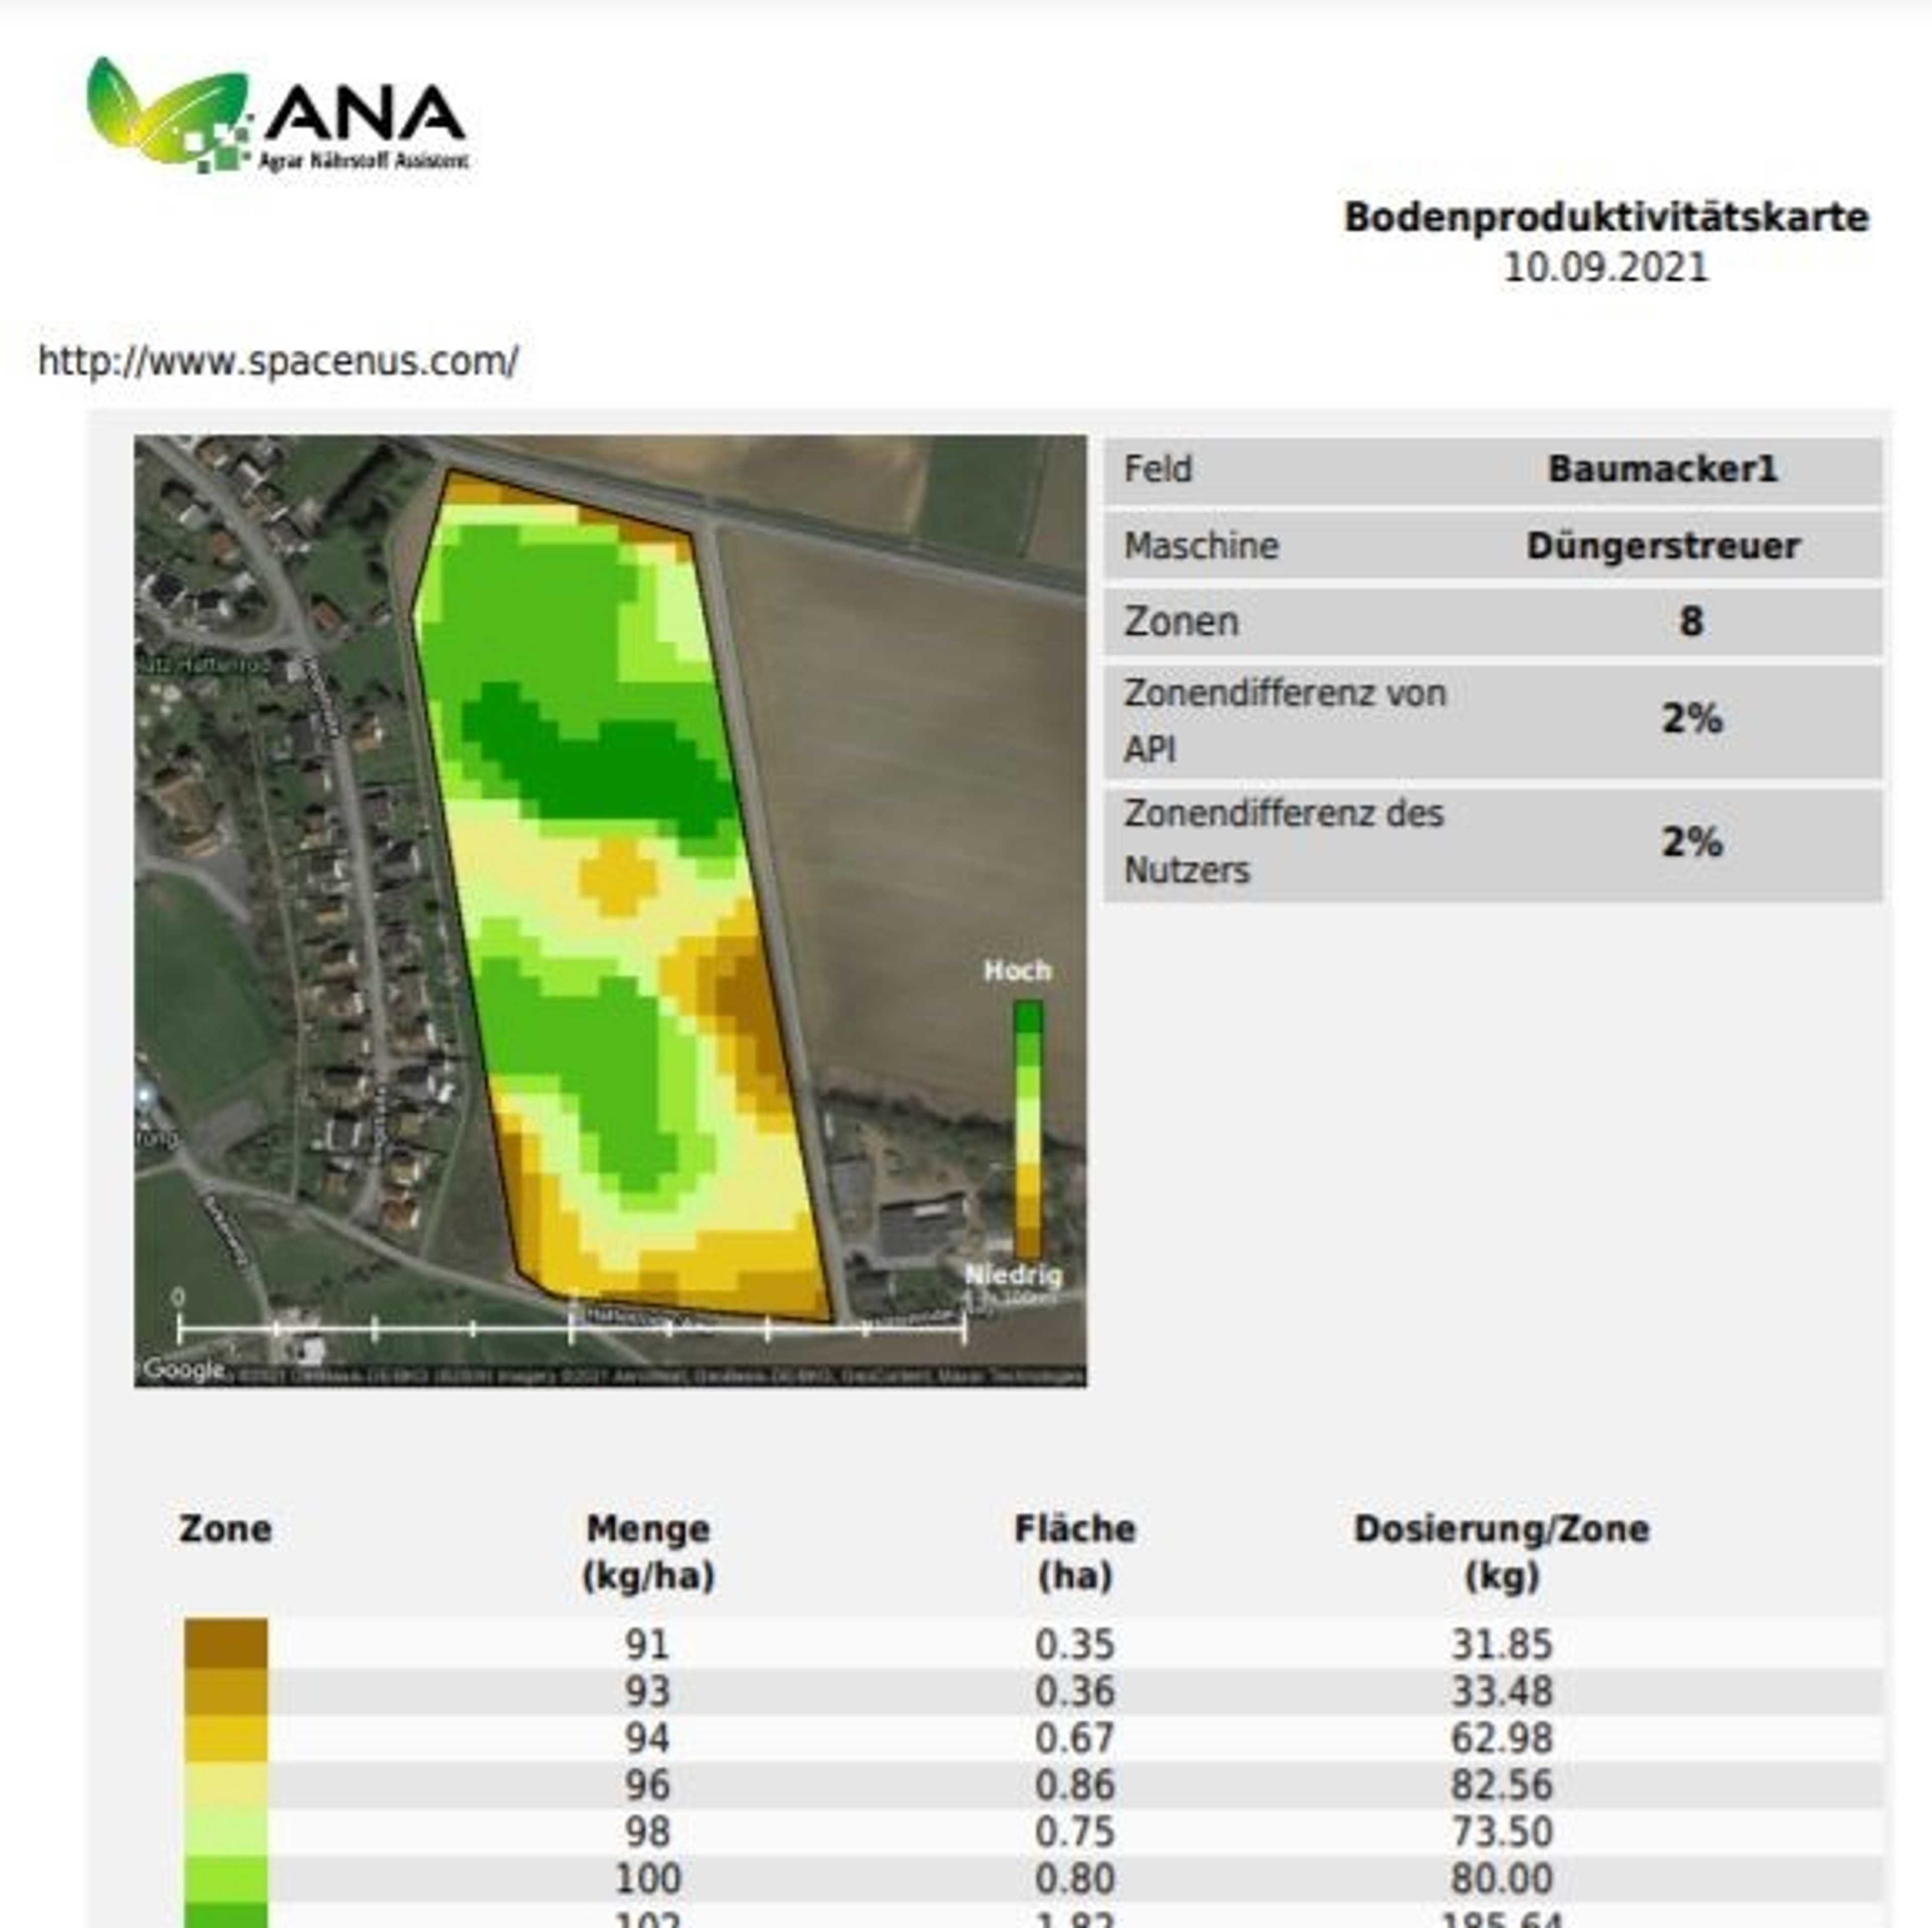


Use application maps to apply fertilizer on a site-specific basis.
In ANA you have several functions, among others the creation of nitrogen application maps. You can create them based on the zoning of the nutrient maps and download them as a shape or ISO-xml file. You decide the application rates yourself. However, the ANA nutrient maps offer you additional supporting information that you can include in your decision. You simply enter the amounts for the main nutrient in the fertilizer, the corresponding amount of the other nutrients contained in the fertilizer and the final amount of the total fertilizer are then calculated automatically.
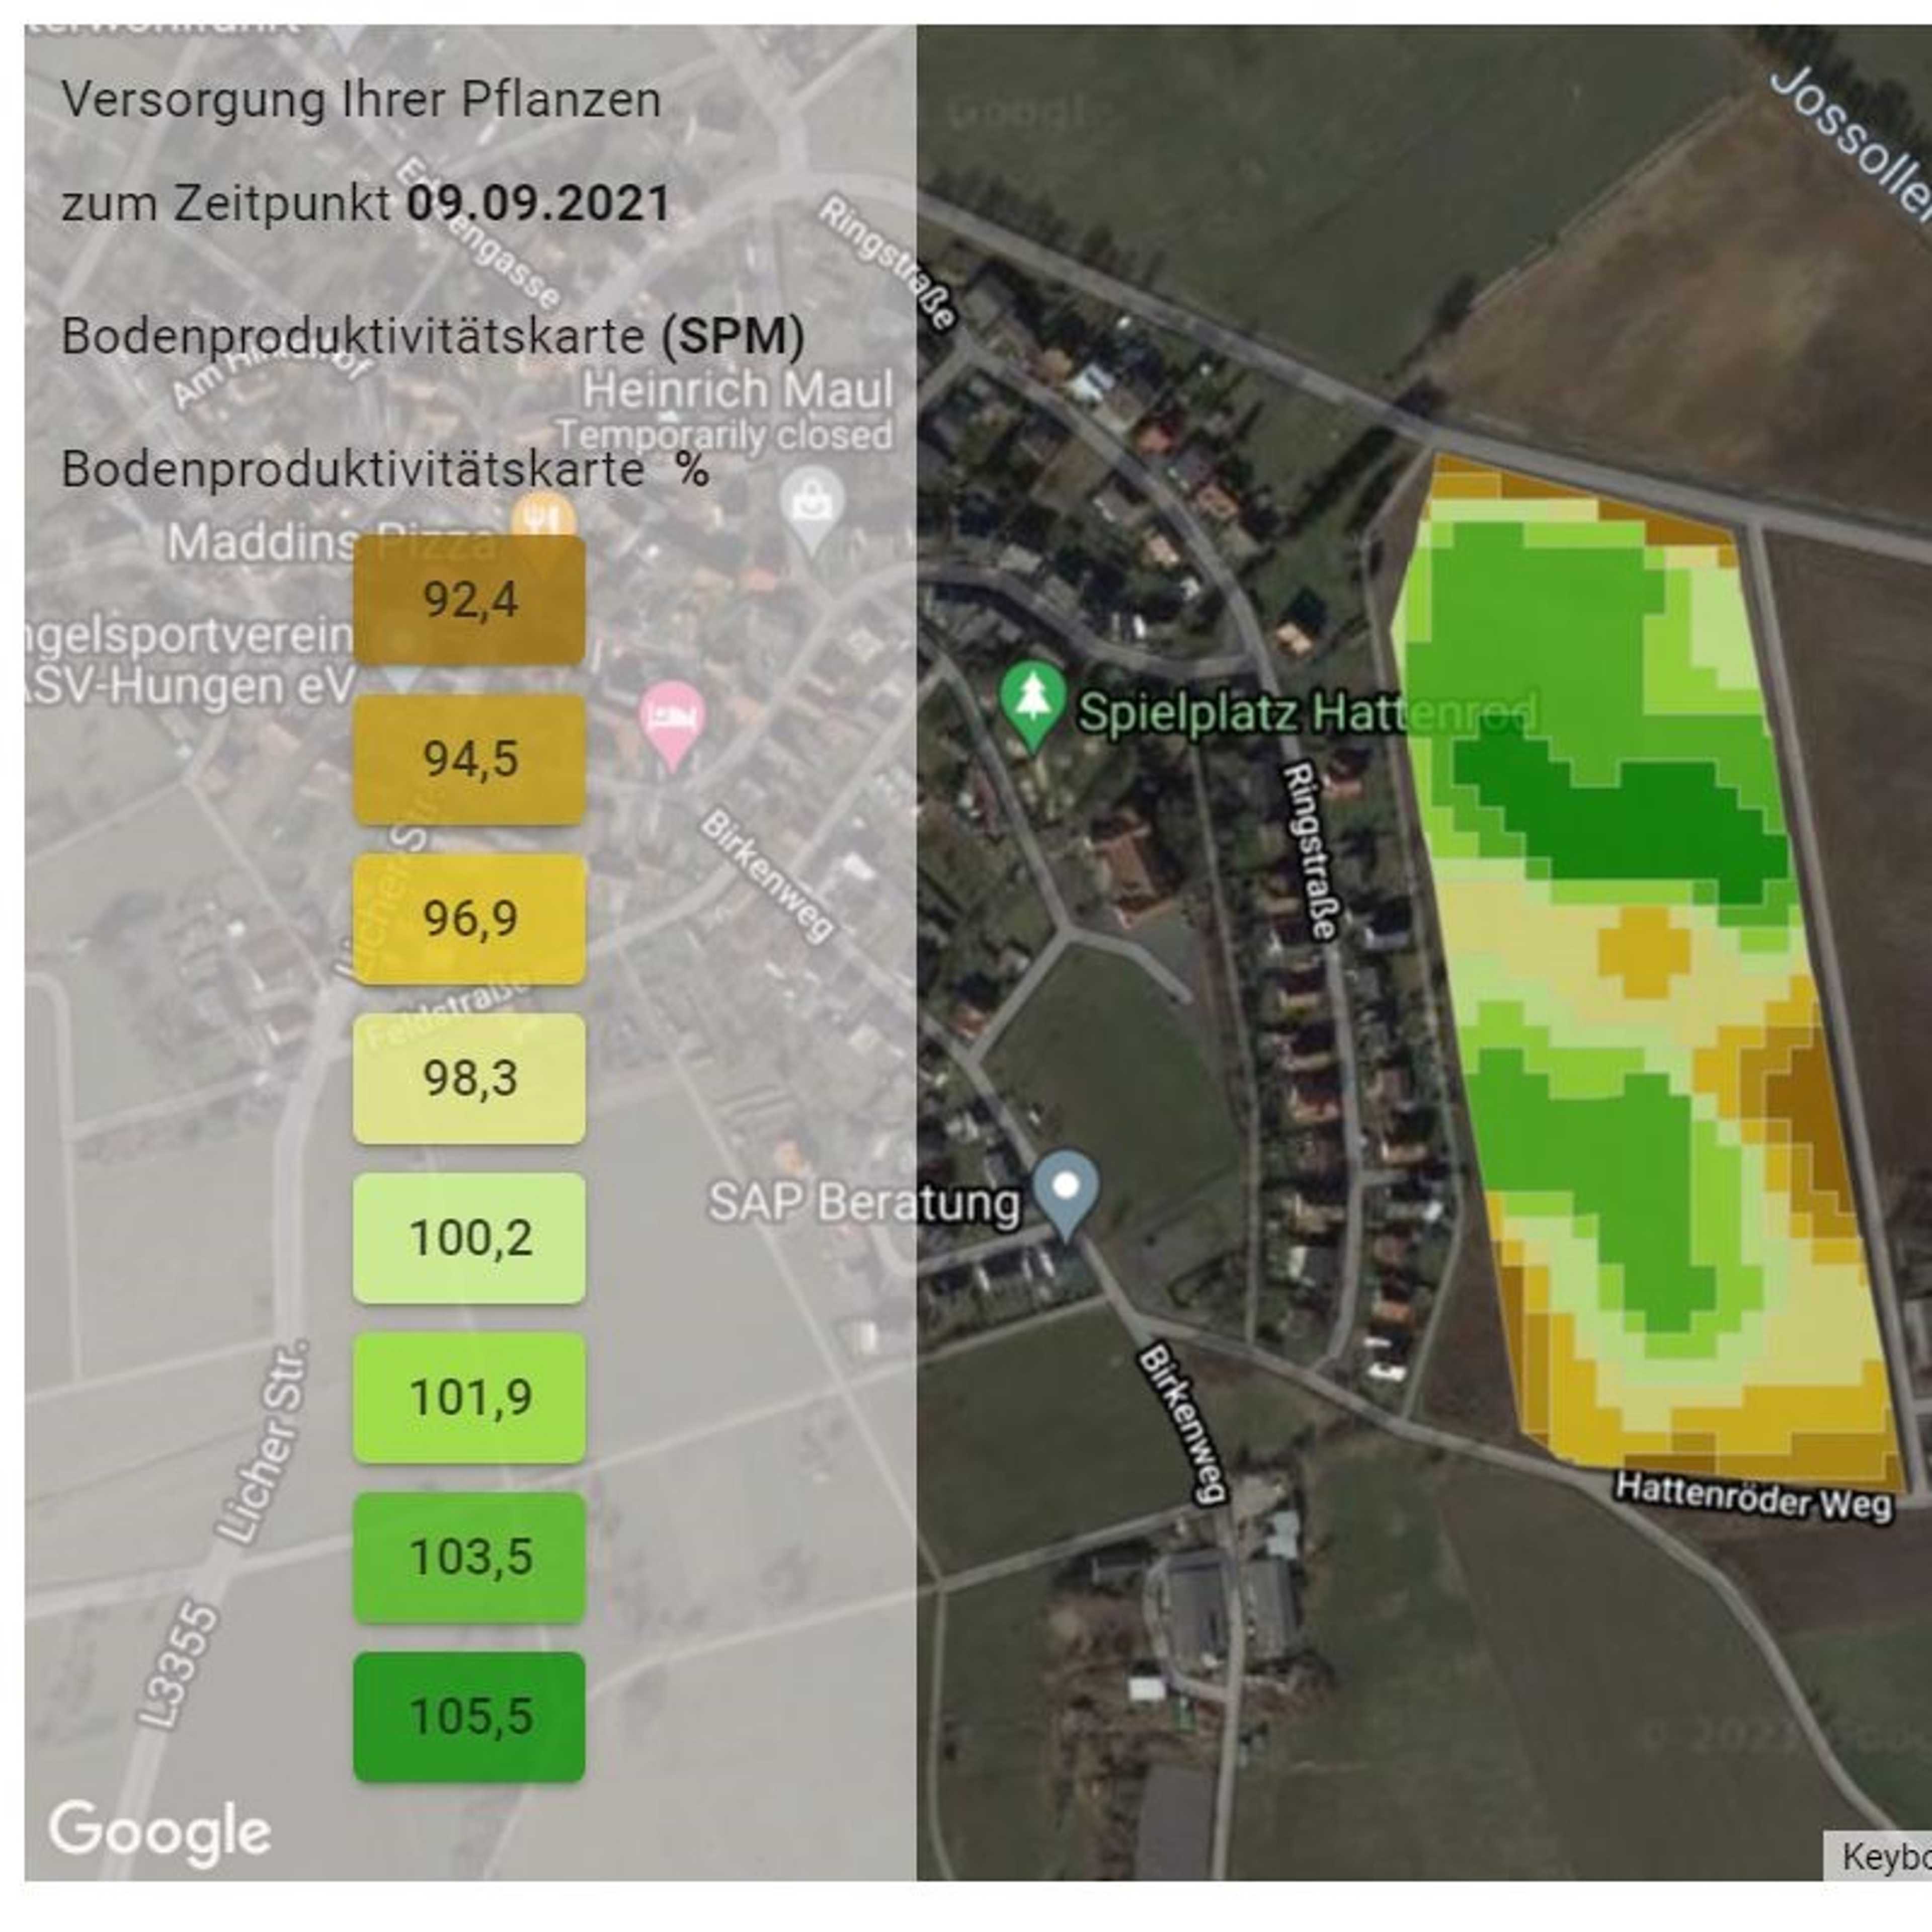
Satellite images and weather data for a variable nutrient map
ANA gives you a detailed insight into the nutrient supply of your crop. It is based on a service that uses learning algorithms in combination with satellite imagery and weather data to generate a variable nutrient map. Precise nutrient quantification, scaled to field level, enables the right decisions to be made for site-specific fertilization.
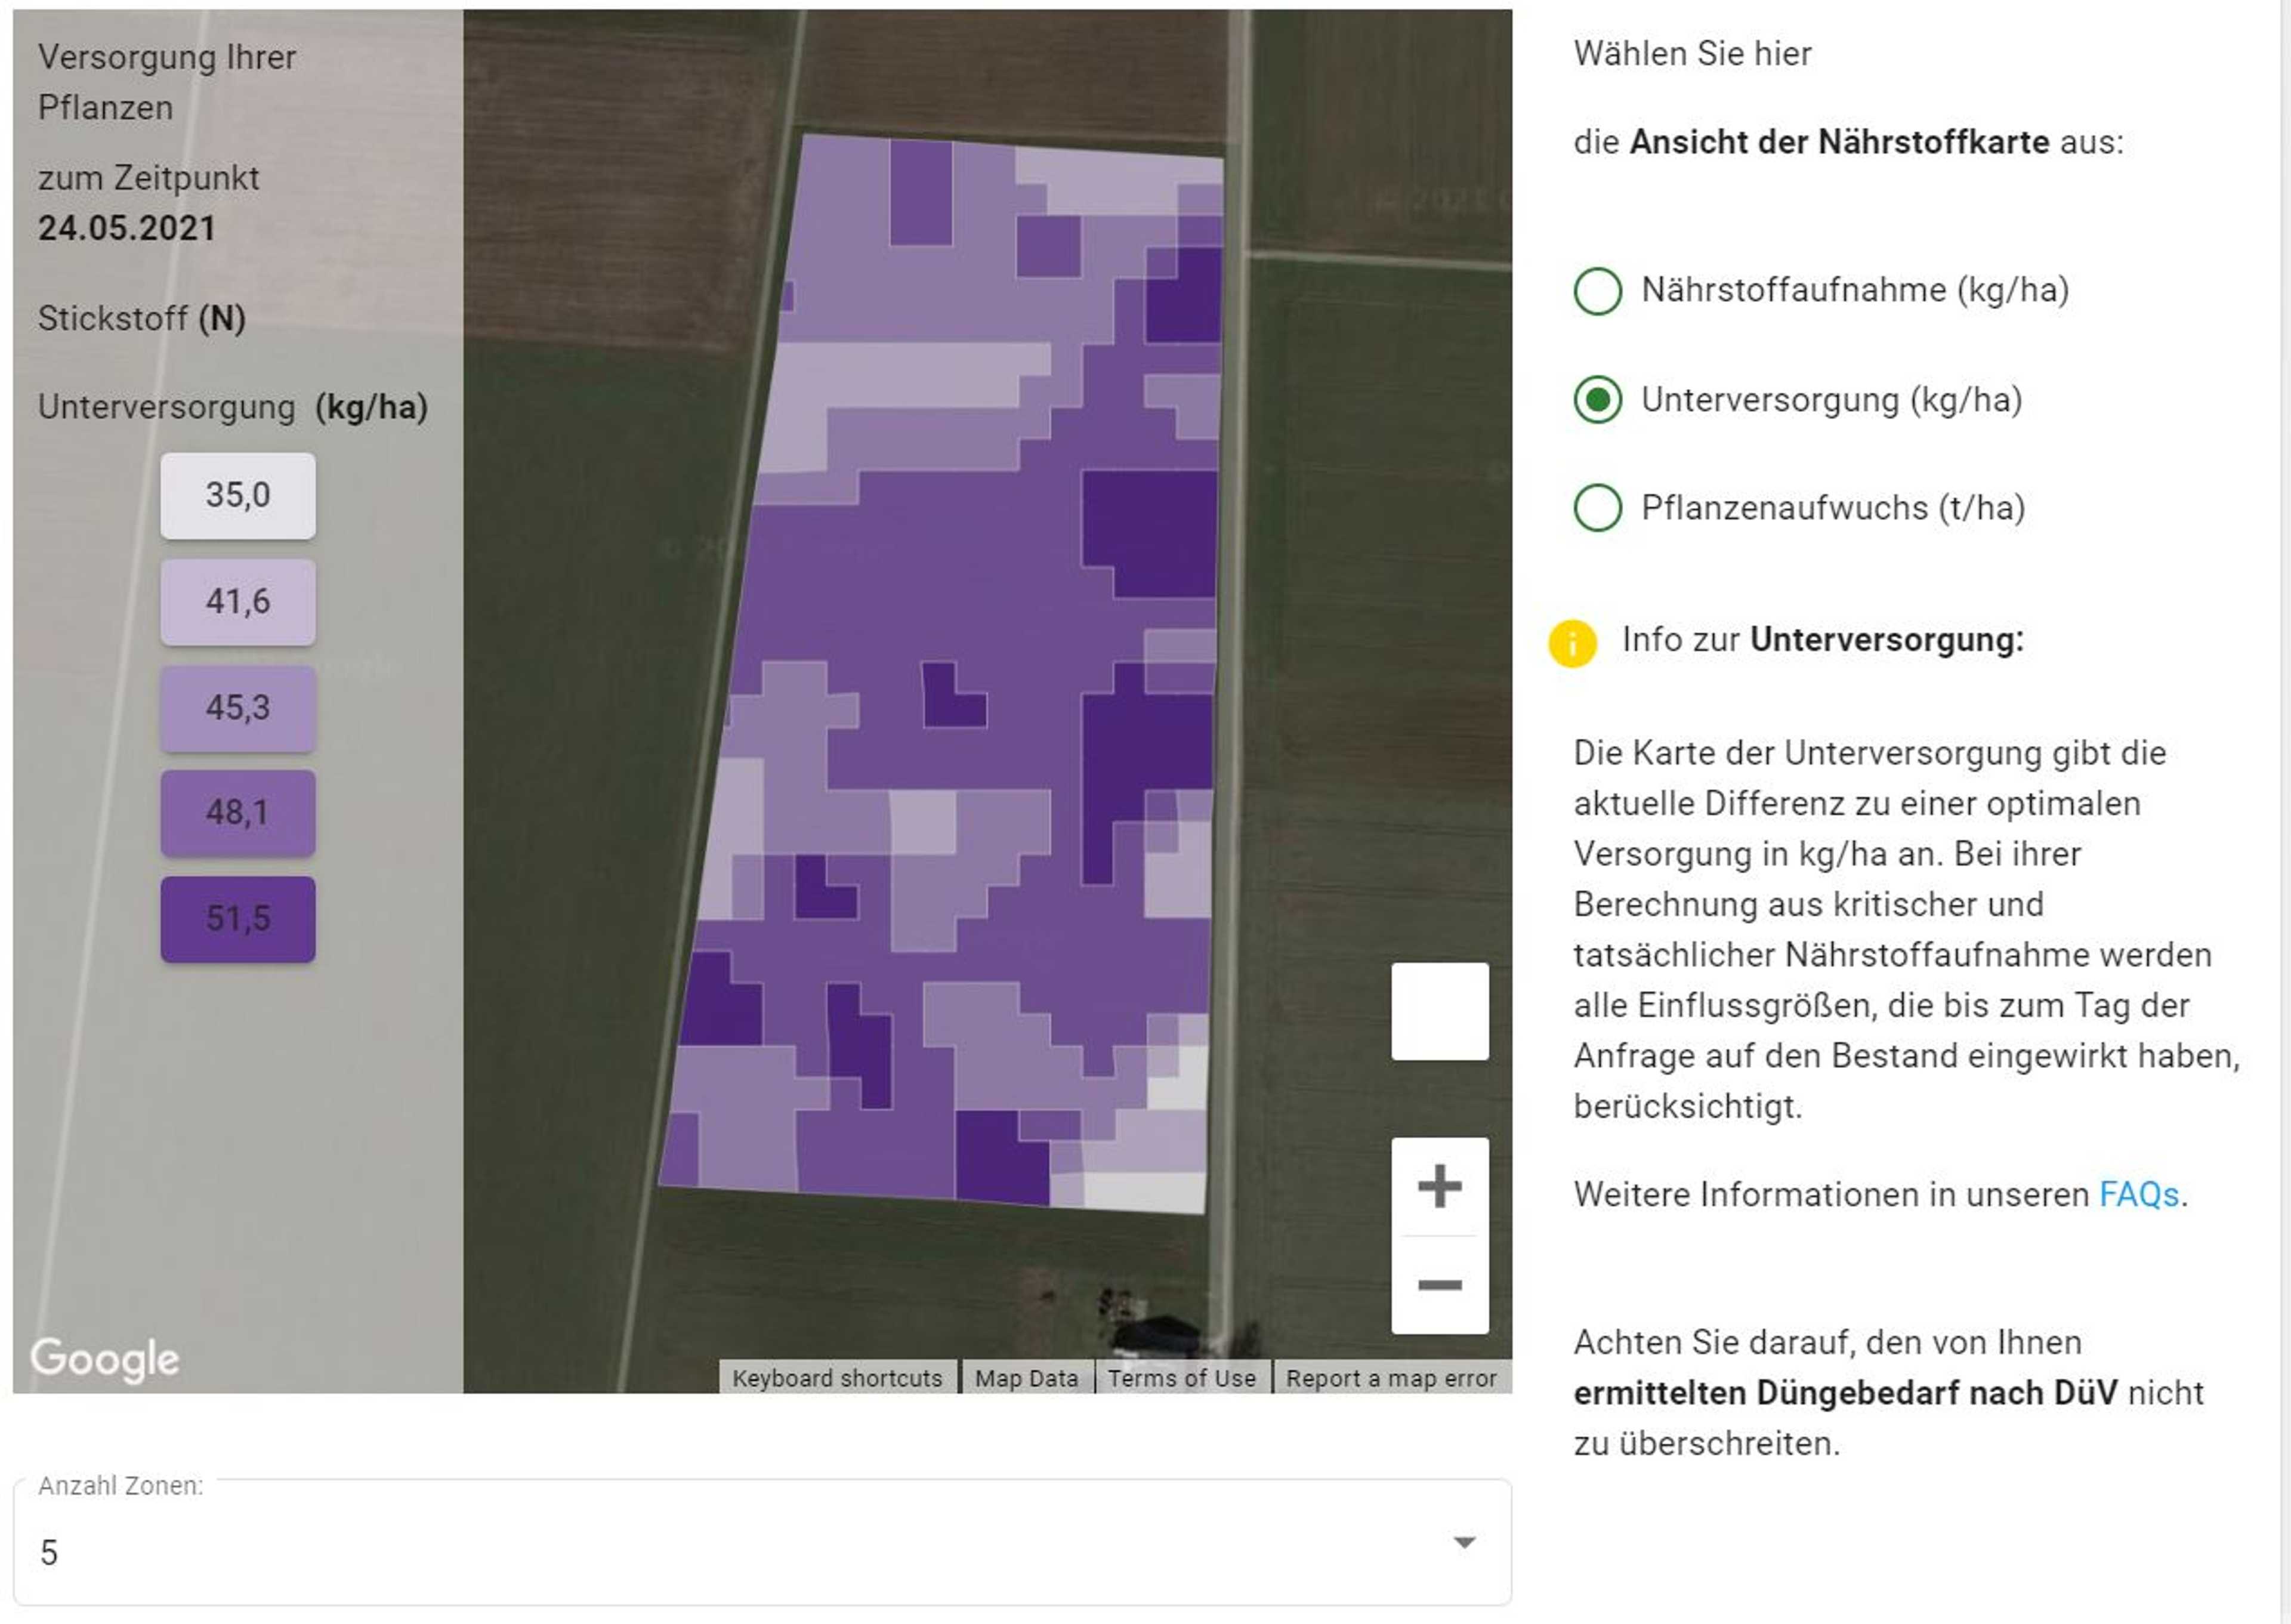
The nutritional status of the plants is displayed in kg/ha with a click.
With ANA, the current nutritional status of the crop can be retrieved in absolute kg/ha, simply by clicking - without laboratory testing and without having to buy or rent an expensive sensor. This distinguishes ANA from other satellite-based services that only provide a biomass or chlorophyll index, but not an actual, absolute amount.
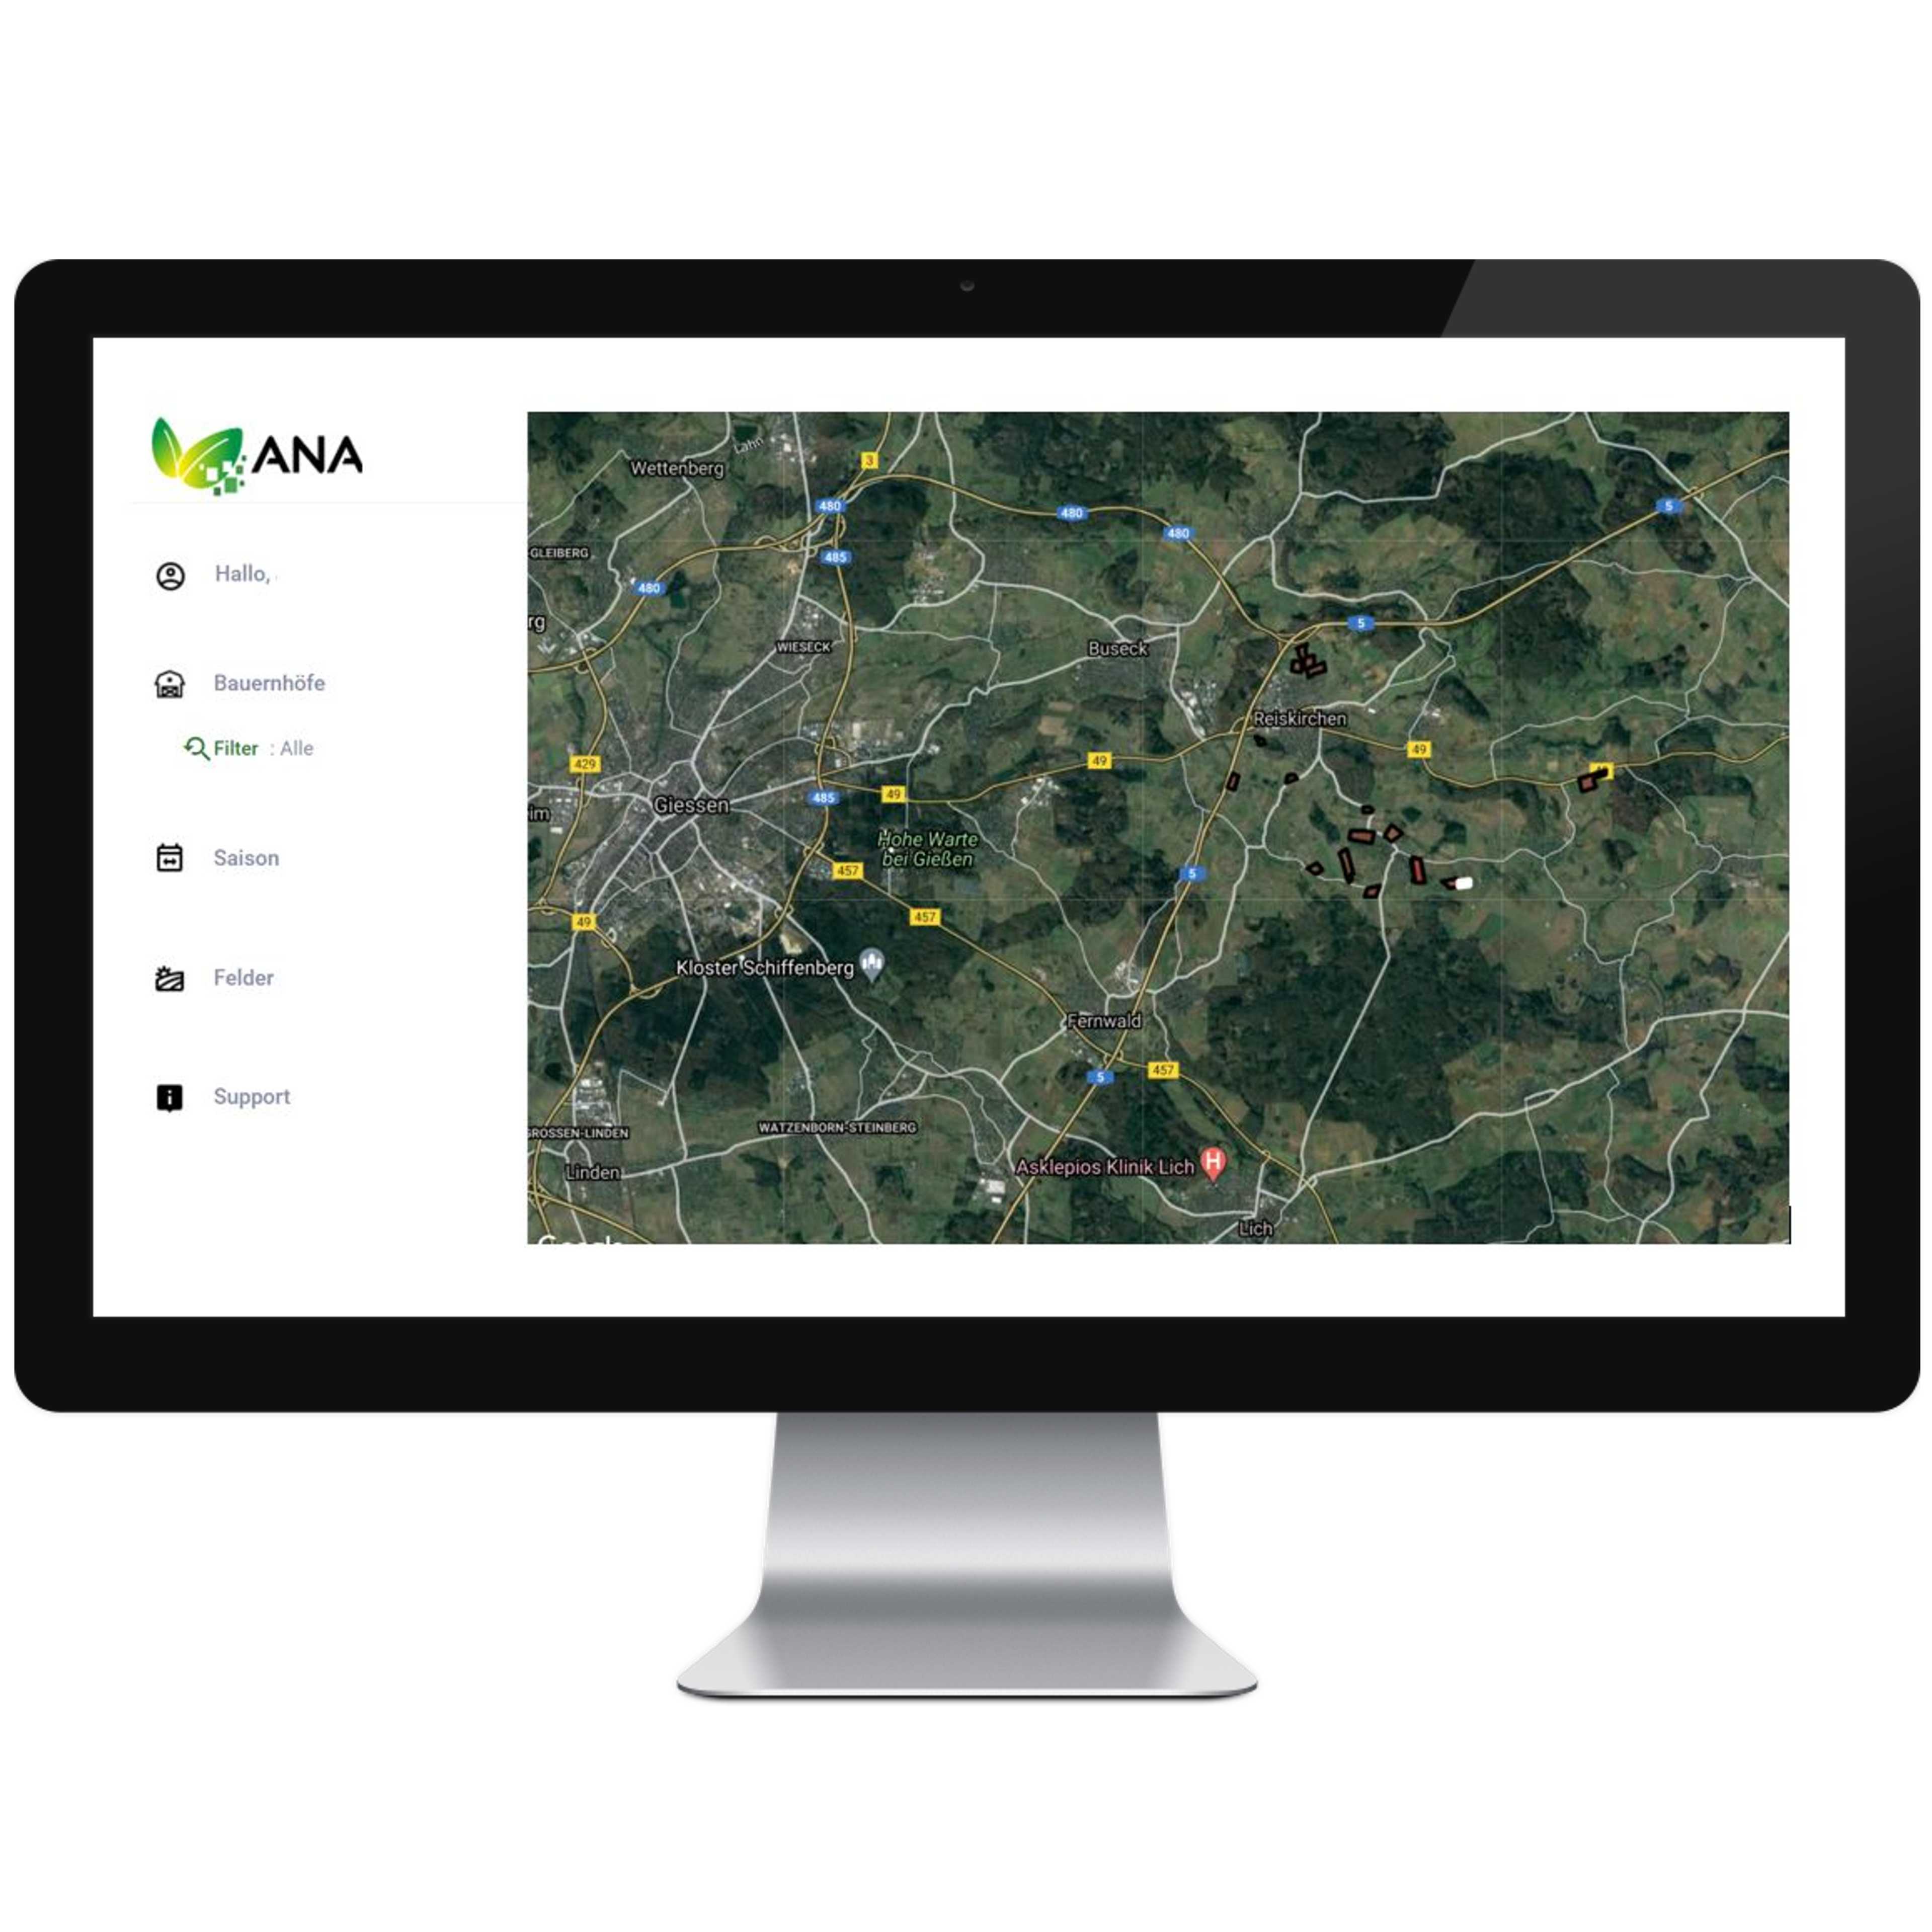
Punches can be created quickly and easily in 3 steps. The automatic detection of the field boundaries by clicking on the map
- Uploading a file - different formats are supported, regardless of whether it contains only one beat or several beats
- Draw in the boundary using the drawing tool.
- Select which analysis you want to perform for the field. You will receive nitrogen maps and soon also soil productivity maps immediately after completing the order.
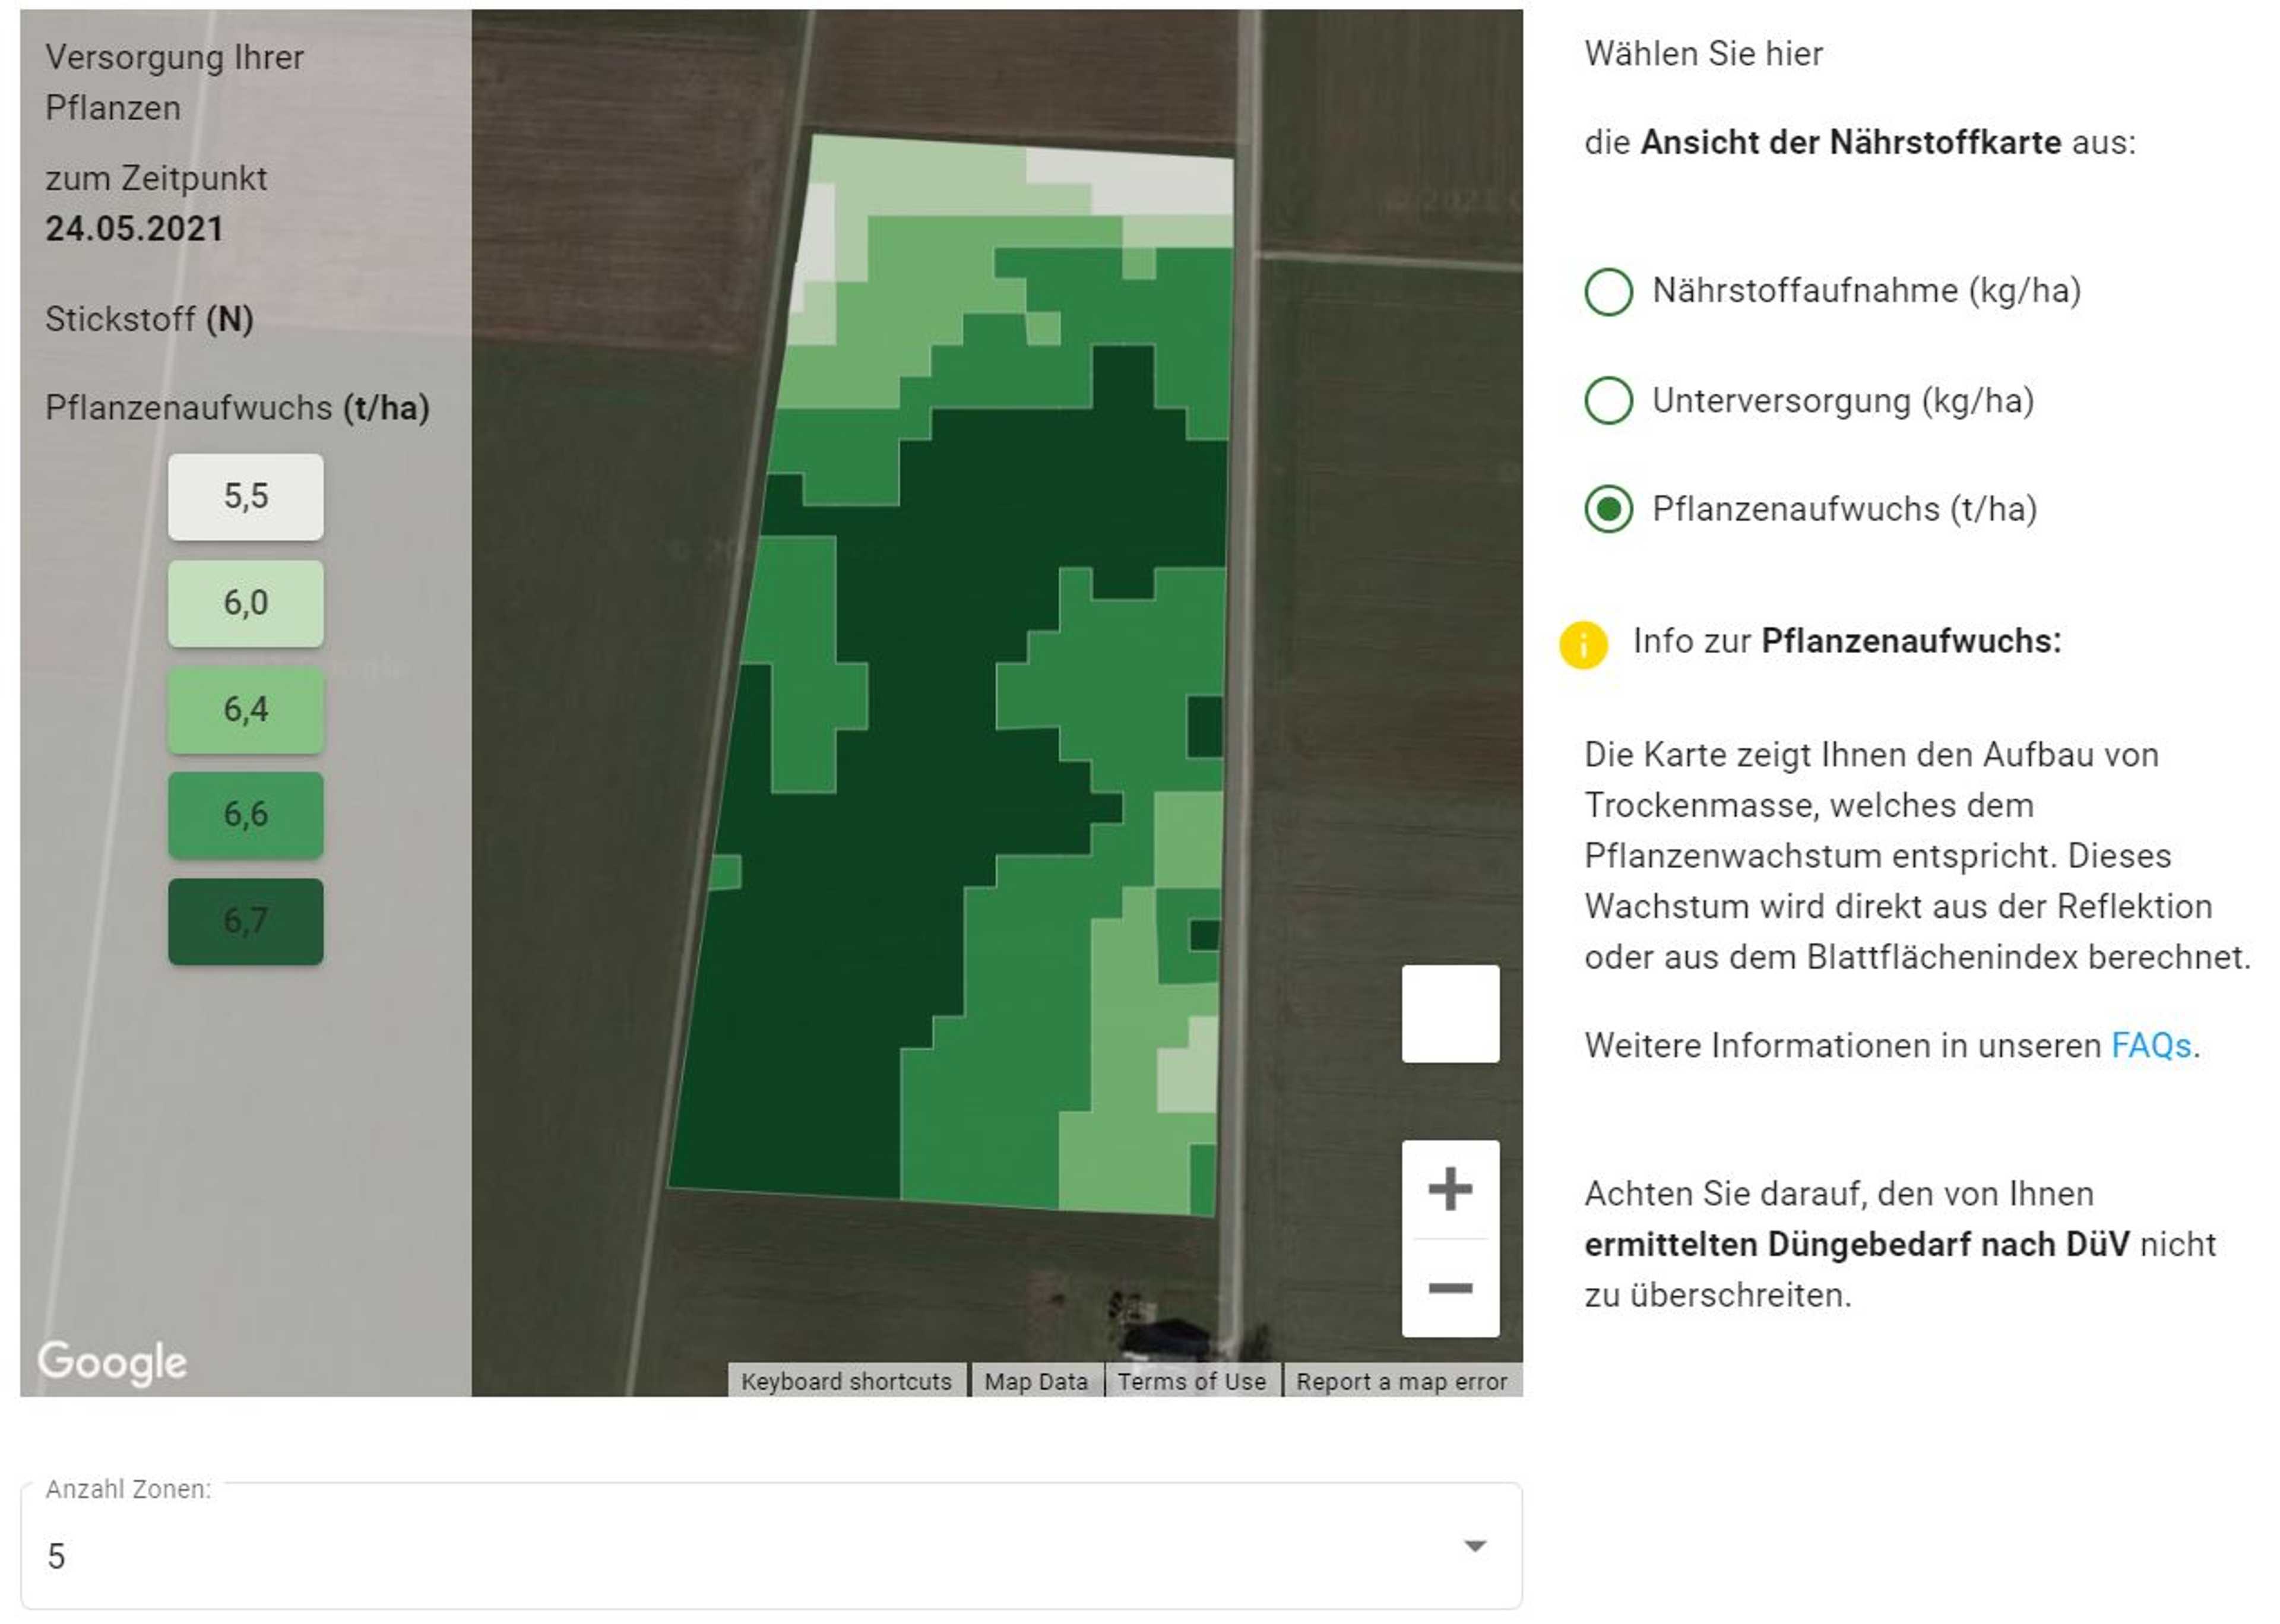

The blow is divided into three nitrogen zones
You will get, just like in the P-K-MG-S (Phosphorus, Potassium, Magnesium, Sulfur) analysis, three nitrogen zone maps for your blow:
- Current nutrient uptake (kg/ha) Current plant growth (t/ha) Current undersupply (kg/ha)
The number of zones can vary from 1 to 10, depending on how finely graded fertilizer is to be applied. If 1 zone is selected, you will get an averaged value for the whole field. This variant is especially useful when the spreader or sprayer cannot technically implement variable application.

Pricing
Ab
1 €
for Hectar
Price depends on the size of the company
Free trial version
Free version
Attributes
Other subarea-specific functions
Economic zone evaluation
Support
Mail support
Remote maintenance
Videotutorials
Software
Browser application
Android-App
Datenintegration
Type of data imports
Plant protection functions
Application maps for fungicides
Fertilizer functions
Fertilizer cards - basic fertilization
Recommendation fertilizer quantities
Company
Spacenus GmbH
Germany
Founding year:
2015