Pessl Instruments GmbH
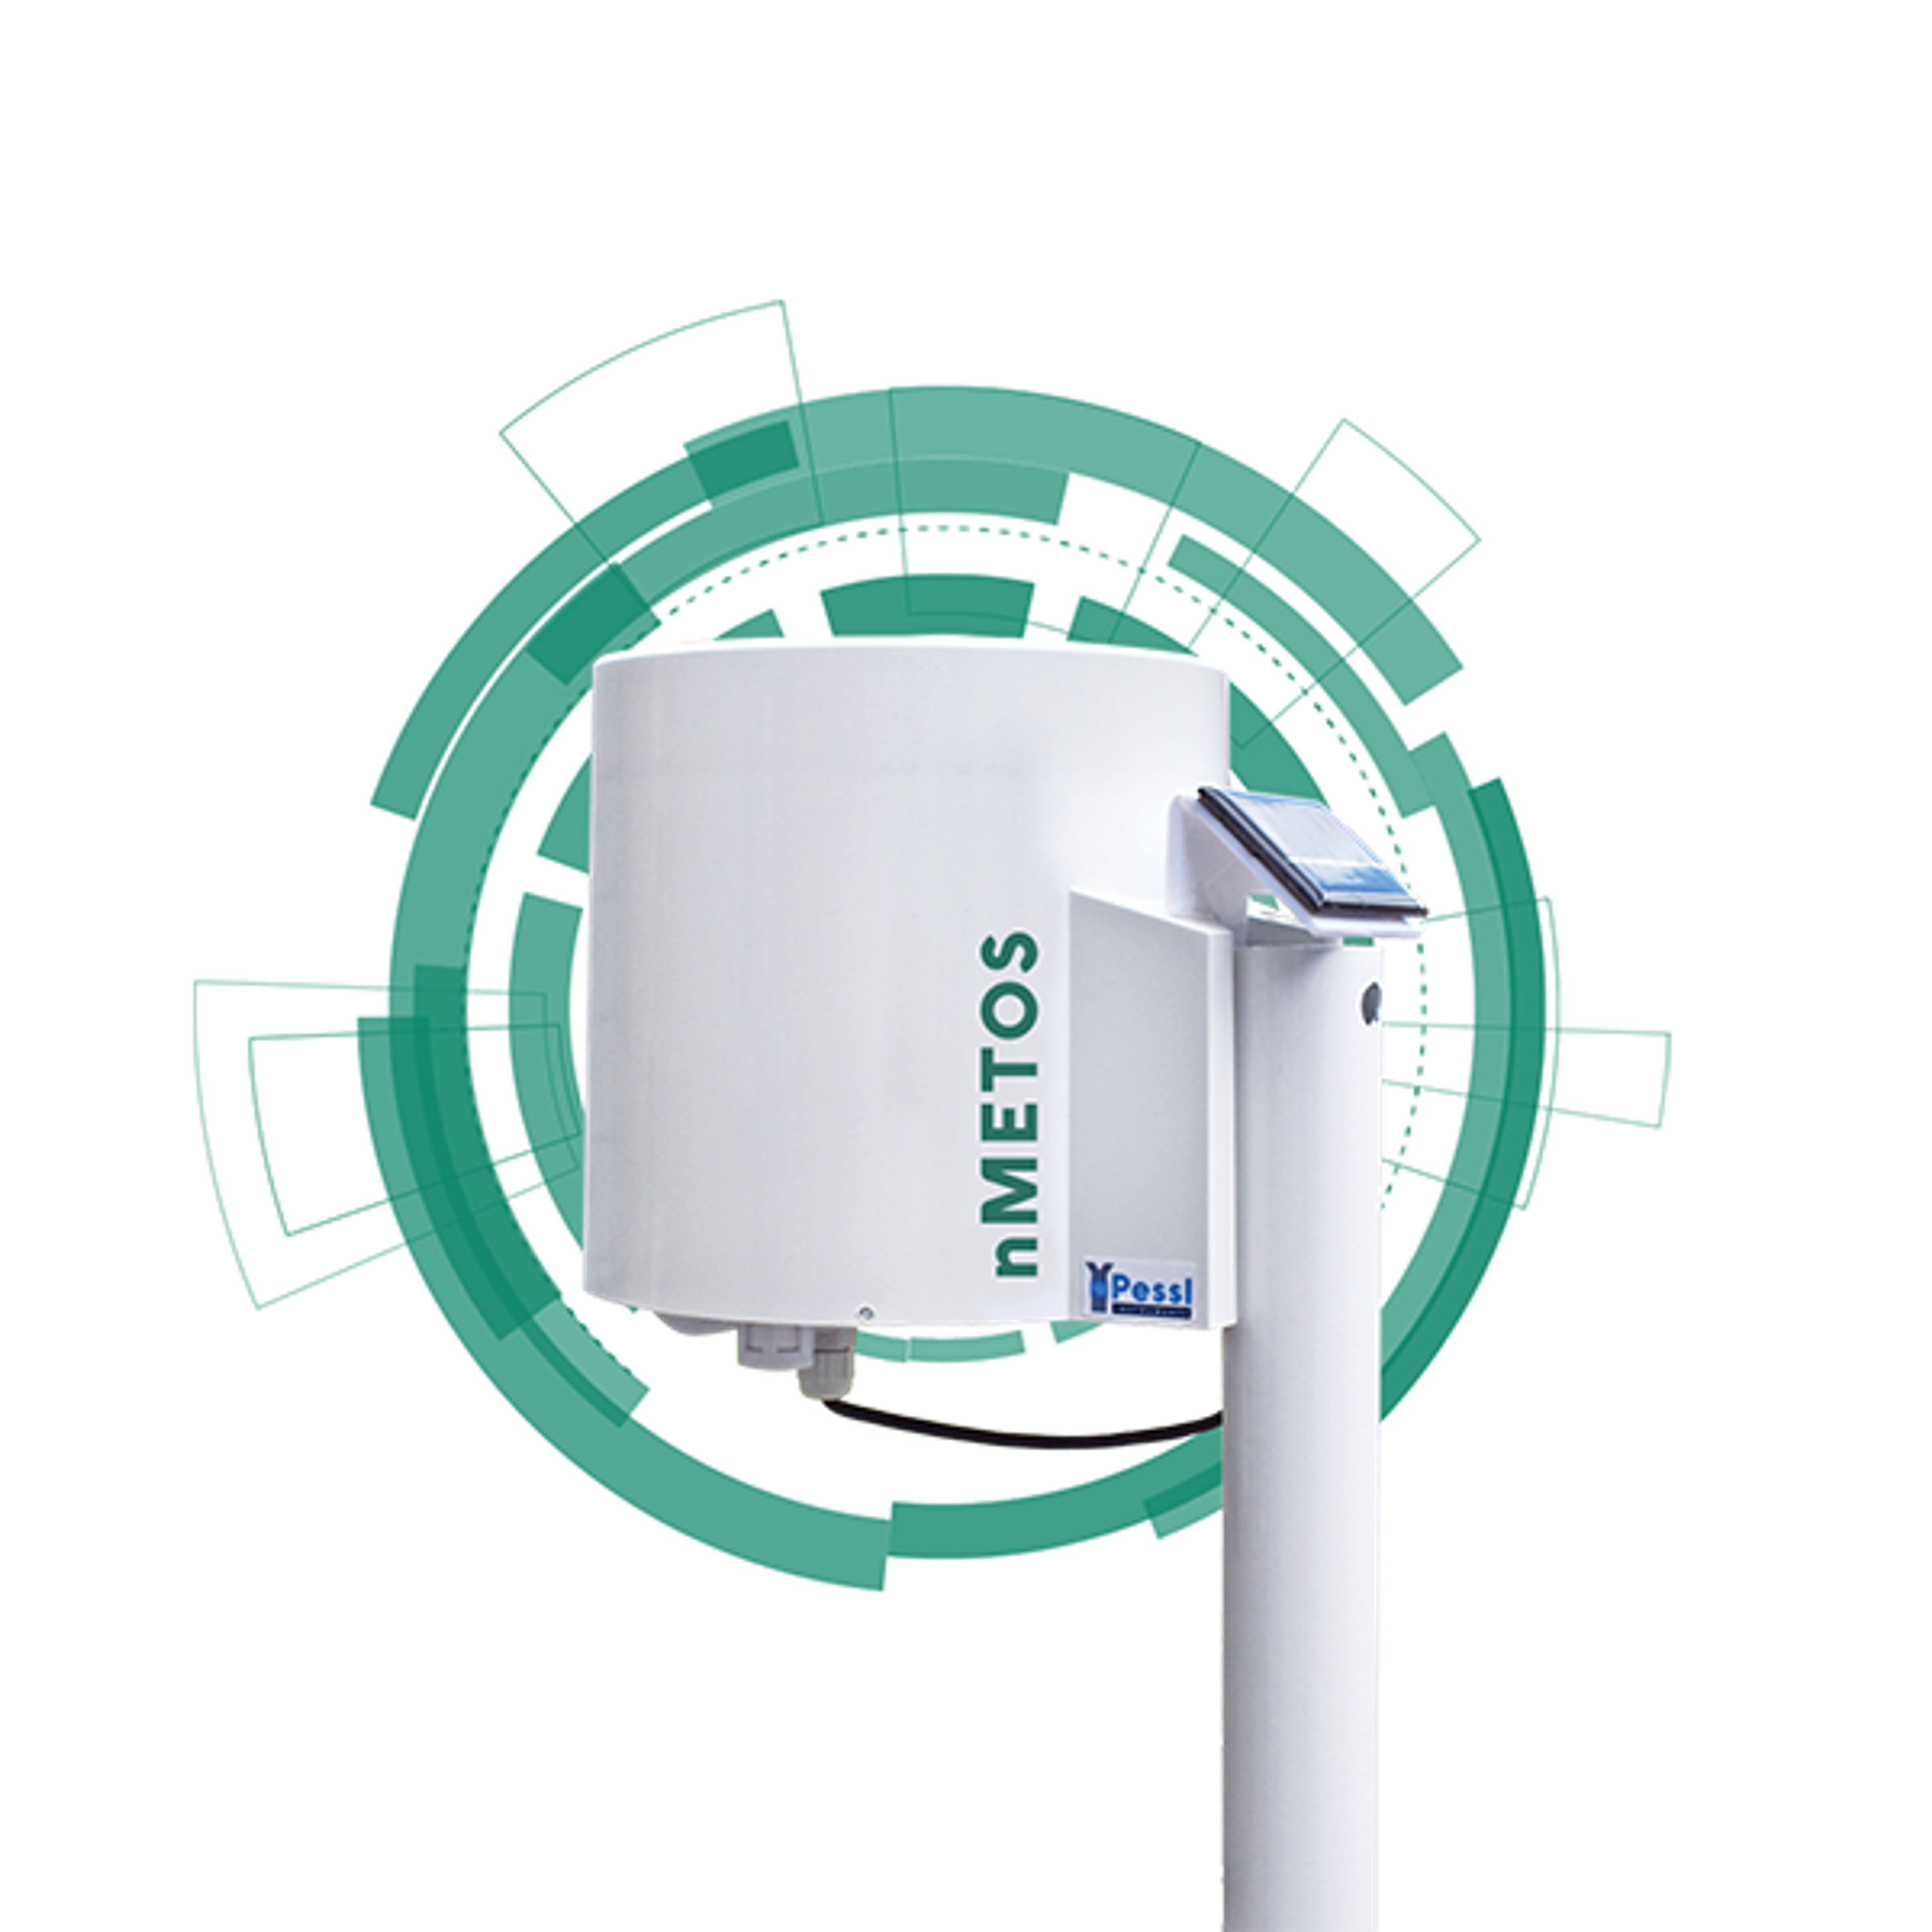
nMetos


Real time weather data from the region
Weather forecast
Irrigation management
Connection to farm management systems
Employee Access


The revolution in agriculture is now - adapting your farming activities to new practices
This is an entry-level weather station that comes withNB-IoT*:
- Helps to measure the most important environmental parameters
- helps prevent plant diseases and insect infestation
- helps with time management (work planning, spraying, irrigation)
- Helps you save time, resources and money
- Reduces the harmful effects on the environment


Product variants
nMetos80: Air temperature and relative humidity CALCULATED: VDP, dew point, DeltaT
nMetos80SM:Air temperature and relative humidity, soil temperature, soil moisture, suction tension CALCULATED: VDP, dew point, DeltaT
nMetos100: Precipitation
nMetos180: precipitation, air temperature and relative humidity, CALCULATED: VDP, dew point, DeltaT, leaf wetness.
nMetos180SM: Precipitation, air temperature and relative humidity, soil temperature, soil moisture, suction tension CALCULATED: VDP, dew point, DeltaT, leaf wetness.
nMetos200: Precipitation, air temperature and relative humidity, leaf humidity CALCULATED: VDP, dew point, DeltaT.


Attributes
Support
Phone support
Mail support
Software
Browser application
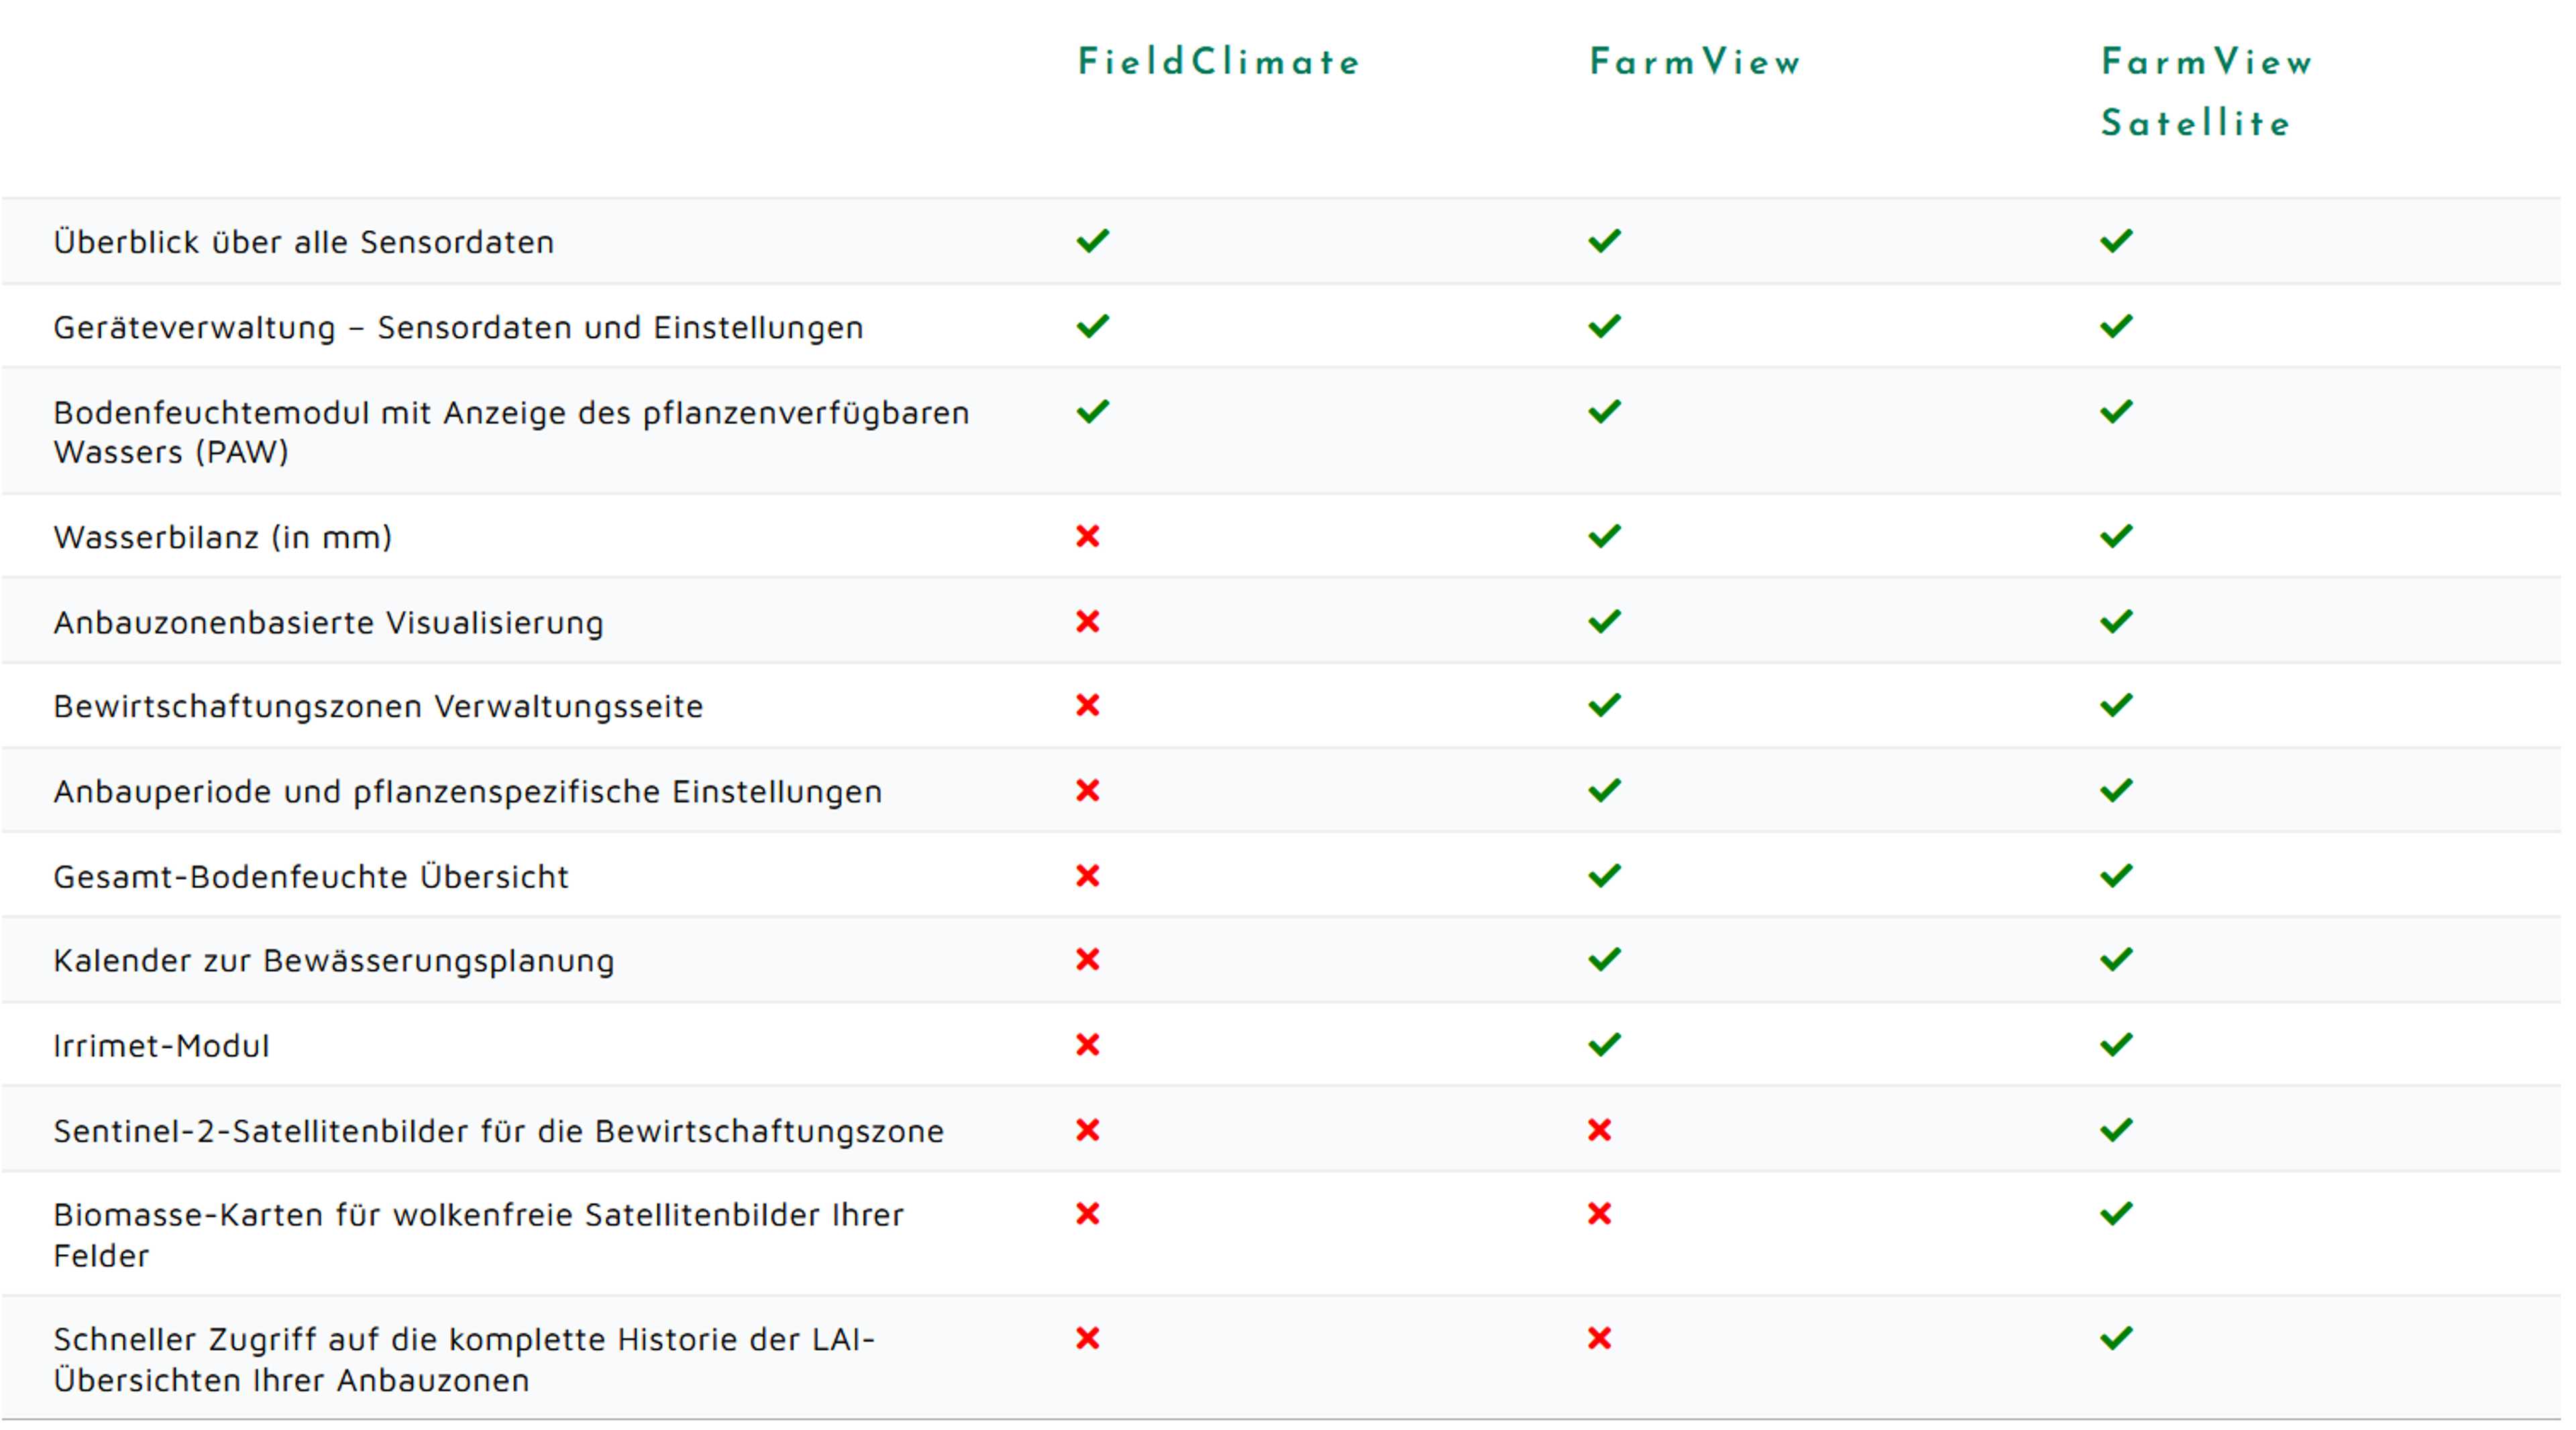
- FieldClimate (Standard)
- FamView
- FarmView Satellite
Android-App
iOS-App
Desktop application
Place of data storage
Agronomic assistance
Recommendation on sowing time
Recommendation on fertilization measures
Forecast harvest time
Climate assessment
Growth Degree Days
Refrigeration units
Refrigerated portions
Accumulated cold hours
Temperature sum
Wet bulb temperature
Evaporation
Dew point
Improving local forecasts
Frost forecast
Frost forecast
Szenariensimulation
Basis of the prediction
Irrigation management
Irrigation management
- Calculate a user-defined average root zone soil moisture curve (the upper full set, known as the full point or field capacity, and the lower set or refill point).
- Different sensor layers can be displayed in graphs in a variety of formats, including standard, stacked, or average.
- Budget lines for full and refill points are color coded so users can clearly see the range of soil moisture for optimal management - red (deficit), green (comfort zone) and blue (excessive soil moisture).
Overview map irrigation sites
Irrigation History
Automatic control irrigation system
Disease Models
Disease forecasting
Available diseases
General data acquisition
Air temperature
Humidity
Precipitation
Soil temperature
Soil moisture
Leaf moisture
Dew point temperature
Stock moisture
Software functions
Weather forecast
Historical weather data
Real time weather data from the region
Notifications in case of value overrun
Employee Access
Connection to farm management systems
Company


Pessl Instruments GmbH
Austria
Founding year:
1984